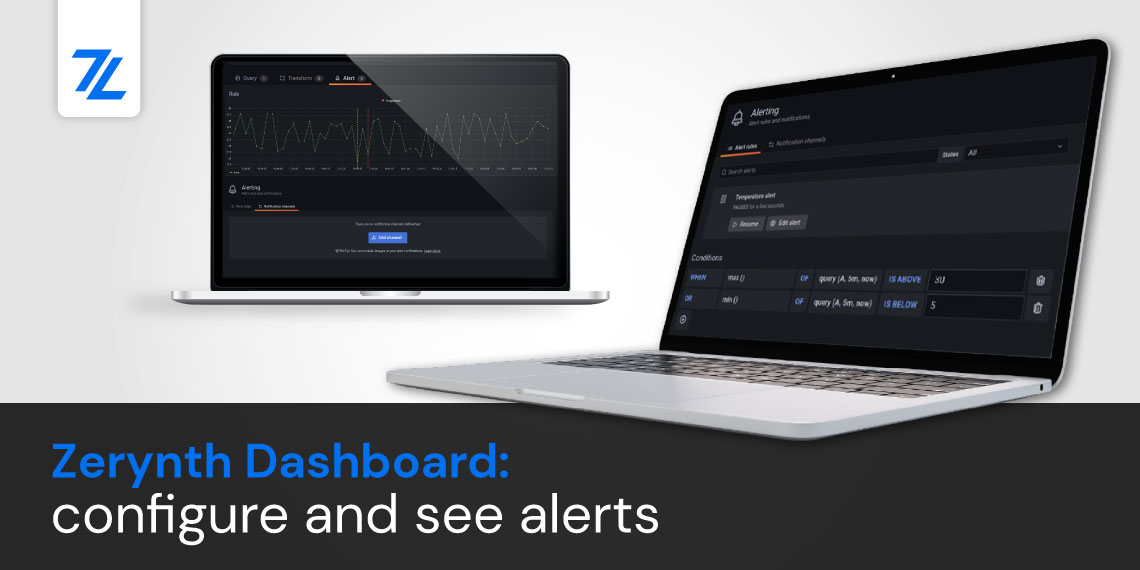
Today, we have another innovative IoT demo to share with you. This time we’ll show you how to connect Grafana with the Zerynth Device Manager and retrieve IoT device data using the ZDM API.
If you’re looking for an awesome and quick way to analyze and visualize your data, look no further than this demo.
Components for getting started
This is what you need to get started with demo:
- Grafana (https://grafana.com/docs/grafana/latest/guides/getting_started/)
- Python Flask lib (https://pypi.org/project/Flask/)
- Python Requests lib (https://pypi.org/project/requests/)
- Python Pytz lib (https://pypi.org/project/pytz/)
To learn more about the components, and how to use them, visit the demo page.
What is Grafana?
Grafana is an analytics and interactive visualization software that allows building dashboards thanks to the connection with various data sources. It is expandable through a plug-in system allowing users to create complex visualization using an intuitive and interactive query builder. It provides charts, graphs, and alerts for the web when connected to supported data sources.
So, now you’re probably wondering what are people most using it for.
Basically, it can help you track user behavior, application behavior, errors, and more. And it has a pretty cool looking dashboard. We’re not surprised to see that some big industry names are using it (such as PayPal, and eBay).
More about the Zerynth Device Manager
Zerynth Device Manager (ZDM) is a device and data management service that makes it easy to securely register, organize, monitor, and remotely manage IoT devices at scale.
Each Zerynth user has access to the ZDM instance hosted by Zerynth. The ZDM is also available on-premises, using container technology, on top of cloud providers (such as Azure, AWS, IBM, Google), or your server. Learn more.
Share This Story, Choose Your Platform!
Follow Zerynth on
Latest Posts


