Recently, several indoor localization solutions based on WiFi, Bluetooth, and RFID have been proposed. Most of these, however, require the active involvement of the subjects, through an active connection to WiFi network or Bluetooth devices.
I prototyped a framework for indoor people tracking with one of my students of the “Design of Interactive Systems” course at the University of Pisa. The framework aims at analyzing the social behavior of people in business buildings and shared workspaces. The goal of the project was to develop a non-invasive system that can give shared space community managers data and insights that are useful for the management of their communities. So, we built a lightweight WiFi sniffer using a cheap microcontroller development board based on the ESP32 chip, that has been programmed in Zerynth.
For 11 days, ten devices have been placed in a business center in Pisa, to understand the behavior of the seven companies, distributed over the two floors of the building.
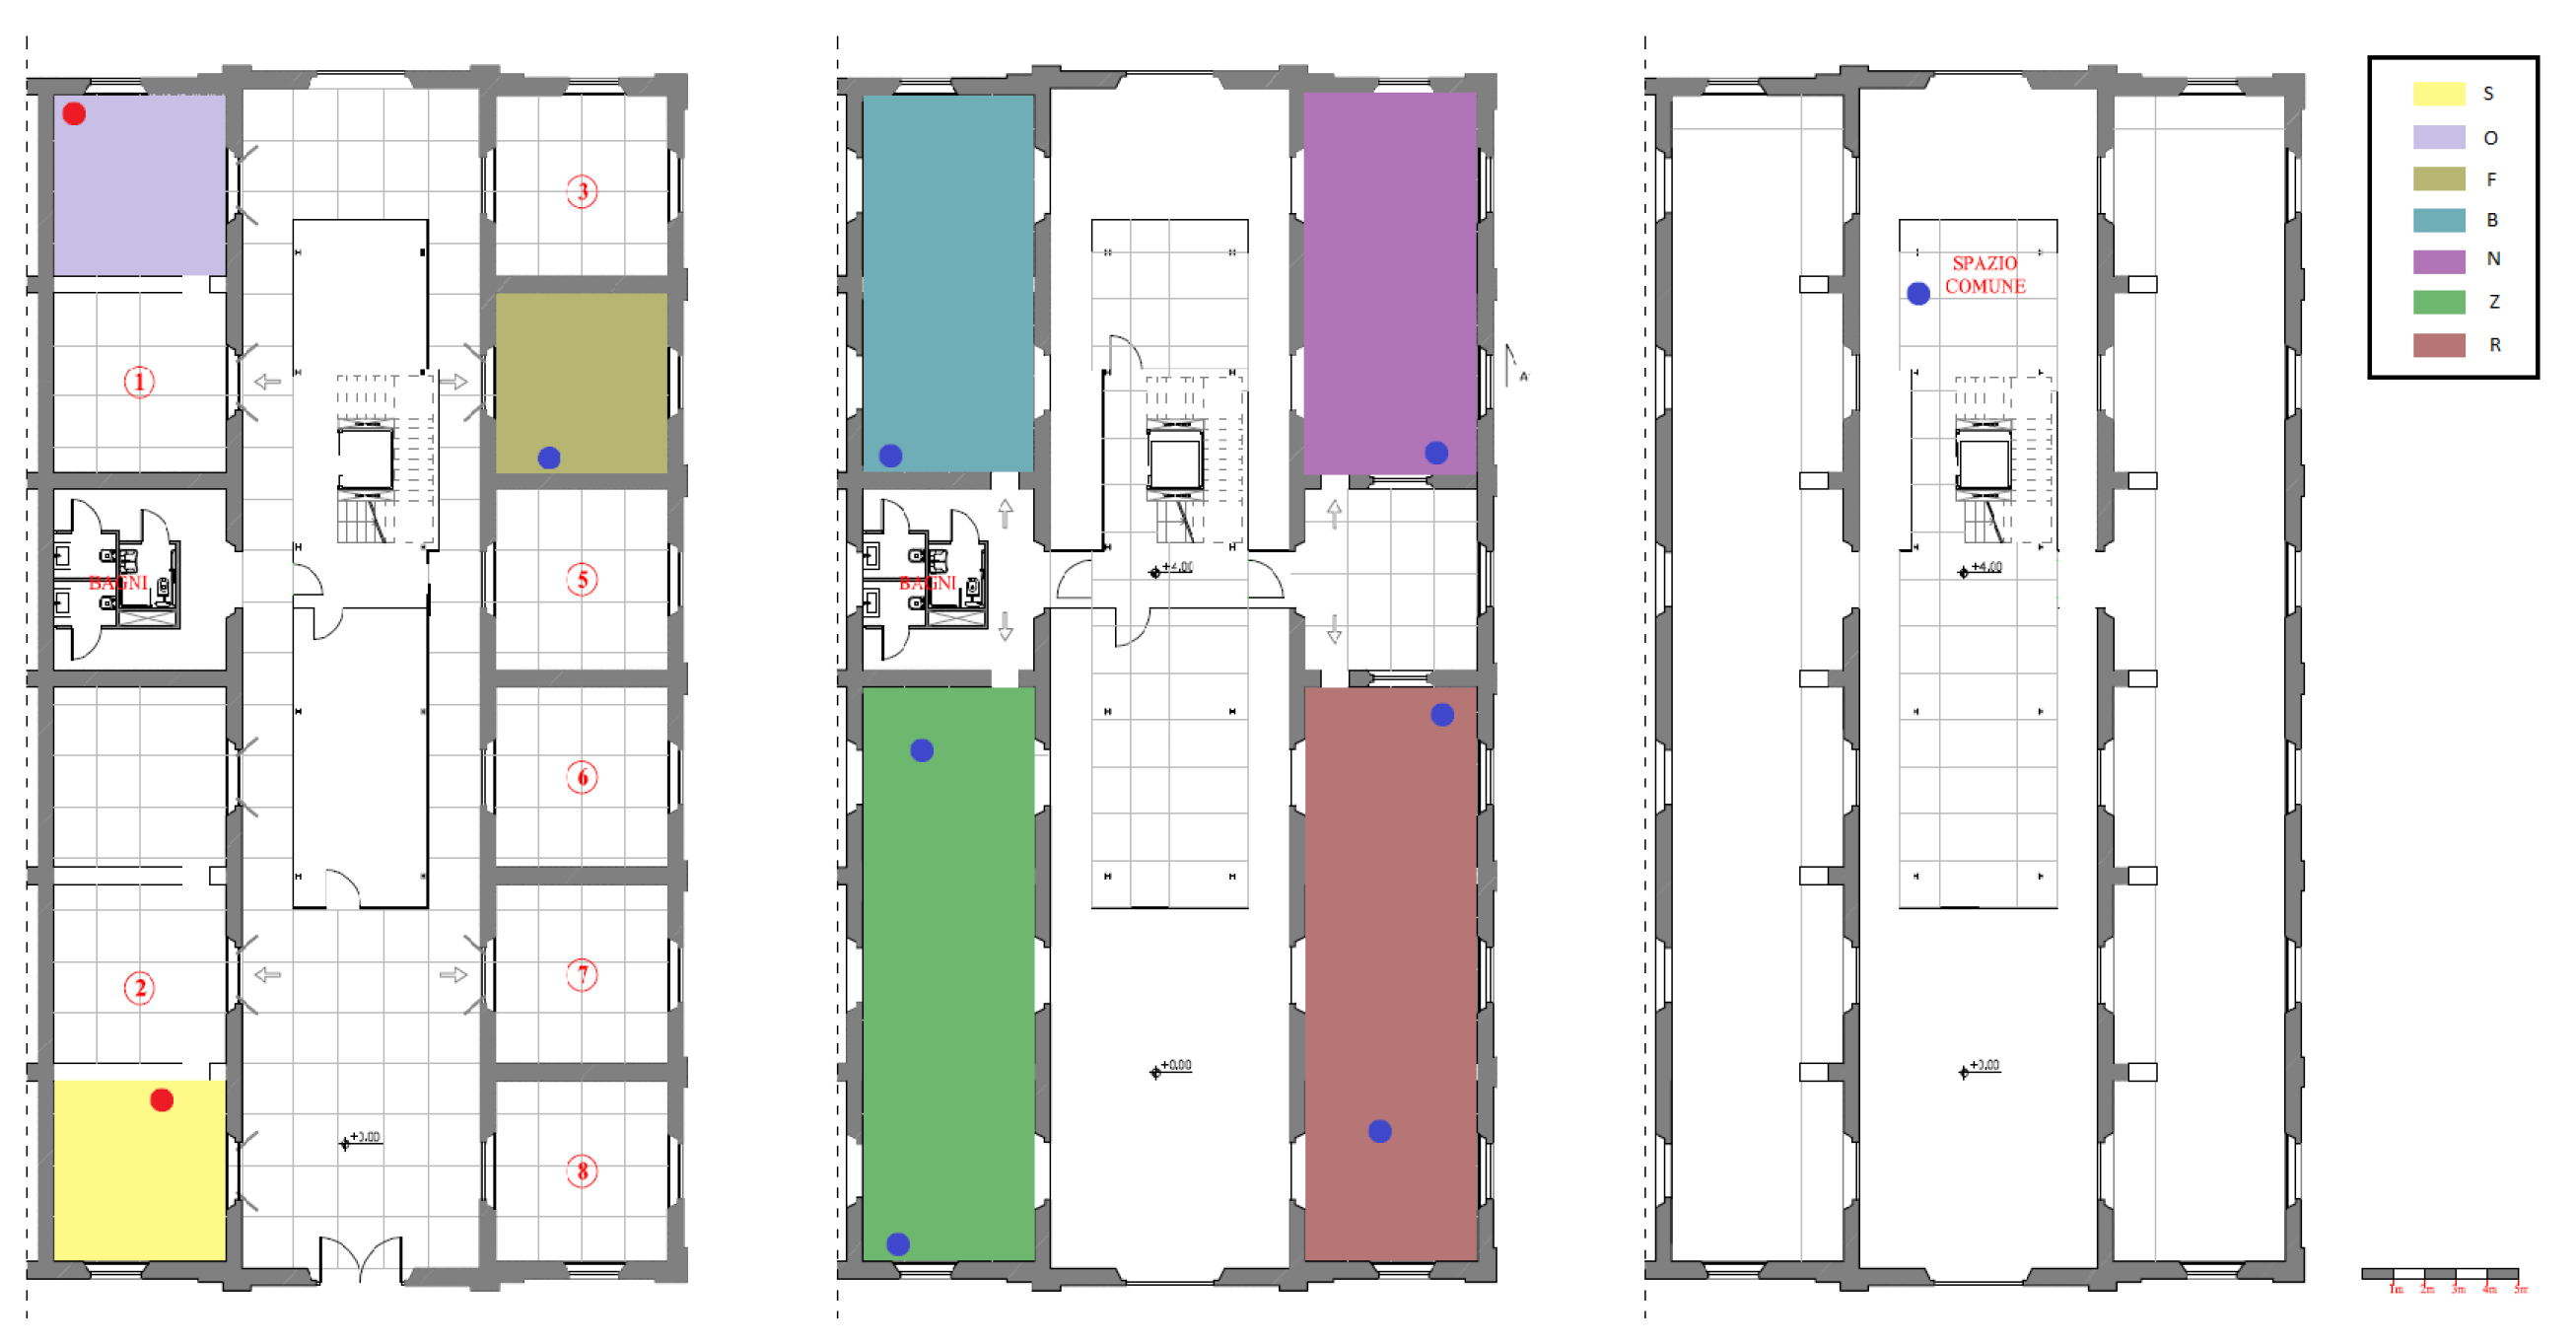
The business space map. Company spaces are highlighted with different colors; WiFi sniffers have been placed where indicated by the blue dots.
Zerynth Crowd Tracker
When this project was later fully developed we called it “the Zerynth Crowd Tracker”.
![]()
The Zerynth Crowd Tracker is a portable electronic device that records real-time gatherings of people in indoor or outdoor spaces (supermarkets, stations, post offices, etc.) by providing information on cloud servers and allowing alarms via email / SMS to the control authorities.
It intercepts the radio packets that each smartphone with active WiFi continuously sends to the access points in the area. Given that most citizens have a smartphone with WiFi on, the device is able to estimate the number of people in the area and communicate it to a Cloud server.
Now, let’s get back to the project.
Capturing the movement of people from WiFi data
The use of Wi-Fi to estimate the presence and location of the subject is widely used nowadays. WiFi devices (mobile phones, computers, etc.) continuously send broadcast messages to discover available WiFi networks. WiFi Access Points (AP) receive these messages that contain a device identifier (the MAC address), and from the analysis of the radio, properties can calculate the RSSI (Received Signal Strength Indication). This procedure is called active scanning, and it is well explained in this article, together with its legal/privacy-related consequences.
In theory, knowing the unique identifier (MAC address) and the signal strength (RSSI) gives you the possibility to track the position of packet senders (the mobile device asking for available networks), by using trilateration techniques. In practice, in real scenarios, this is impossible for the following reason:
a) WiFi device vendors introduced MAC address randomization algorithms to avoid active scanning;
b) signal strength isn’t an absolute value. Each mobile phone has different radio power and antenna shapes. So if two different devices are placed at the same distance from an access point, they can send packets that are received from the AP with different RSSI. Moreover, building structures like walls, doors, and furniture influence the signal propagation thus increasing the RSS.
So, we are unable to understand who is asking for the available network and where it is.
Let’s think about this some more
In 11 days the ten probes collected messages from 121396 MAC addresses. This number is super affected by the devices MAC randomization feature and is not representative of the real number of devices\people available in the business center.
Database cleaning process
- Step 1: All MAC addresses that were detected at least once during nighttime (between 12 A.M and 5 A.M.) were deleted from the datasets. This step is necessary to remove MAC of other sniffers, WiFi AP, and fixed always-on devices such as desktop computers.
- Step 2: This step aims at splitting the dataset into two sub-dataset: Workers and Visitors. All MAC addresses appearing on the dataset for more than 5 days on a total of 11 days of the acquisition were added to the Workers dataset while others were added to the Visitors dataset if detected for at least 30 minutes.
- Step 3: This step aims at removing random generated MACs. MAC Vendors API is a web tool based on a MAC address DB that allows inferring the vendor of a WiFI chip taking as input the MAC address. Using the MAC Vendors API, we cleaned the two sub dataset removing all the MAC address not associated with a vendor assuming that they were randomly generated.
- Step 4: All the MAC addresses that presented a maximum RSSI lower than -90dB (very bad signal) were discarded because we assumed that with such a low signal that device never entered in one of the monitored rooms.
After these cleaning steps, the initial 121396 detected unique MAC addresses were reduced to 52 addresses for the worker’s dataset and 178 for the visitor’s dataset.
Understanding the behavior of people
Workers dataset: The room (sniffer) in which every MAC address had the maximum RSSI on average over the 11 days was found. This feature has been considered as an indicator of where the device passed most of the time and so has been used for assigning MACs to companies. MAC addresses with a maximum RSSI value in the shared space were discarded.
Data coming from the same MAC address (for any detector) were grouped every five seconds, and the detected RSSI was averaged antenna by antenna. In this window, every appearing MAC address was considered to be located in the room in which the antenna that detected the highest RSSI was placed.
Does it work?
This method is clearly affected by errors due to the MAC addresses the randomization method. The cleaning of the dataset is based on very basic heuristics, and it is probably not optimal.
However, with a hardware investment of less than 150€, we have been able to monitor a business center of 1500 squares meters where seven companies are located.
Number of workers estimation
The 52 worker’s MAC addresses were associated with companies (B, F, N, R, Z) inferring the number of employees: B: 4; F: 4; N: 12; R: 18; Z: 14
The number of employees located in their company rooms during one working day has also been calculated.
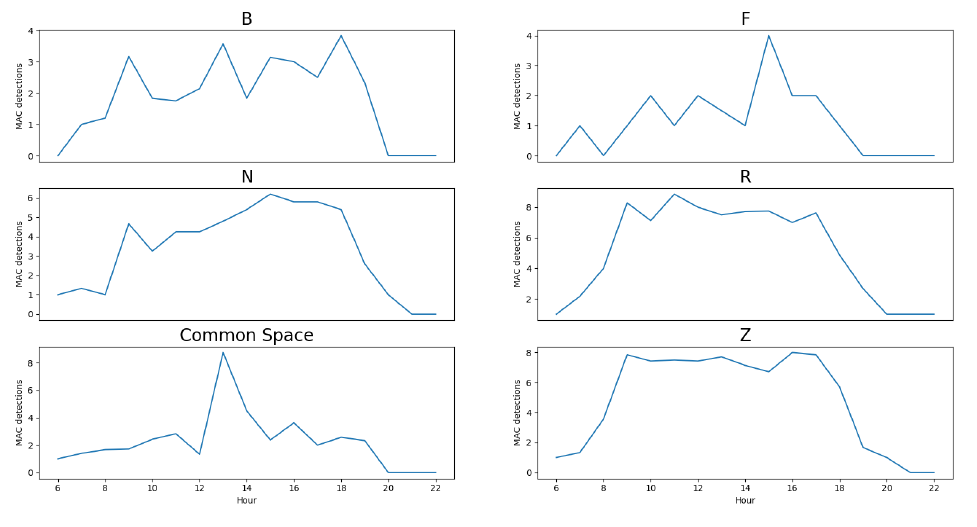
Number of “workers” devices located in their company room over a day
The 178 visitor’s MAC addresses were assigned in the same way to the companies calculating the maximum number of visitors each company had:
B: 4; F: 1; N: 11; R: 69; Z: 61 and 32 assigned to the common space.
The number of people visiting each company during one working day has also been extracted.

Movements of workers between companies have also been extracted inferring how people are moving within companies’ spaces, thus extracting an indicator of business collaborations active in the business center.

The same data plotted as network graphs show a clearer picture of the business dynamics active in the business centre — highlighting which companies are more involved in collaborations.

Network graph generated from the worker dataset
It is clear how companies aggregated in the business center established different collaborations between each other, and it is also clear, which are the most collaborative companies.
The network graph allows us to immediately understand which are the most collaborative companies, and which collaboration clusters are born in the business center.
This technique is affected by errors and isn’t suitable for precise people tracking or counting for security purposes. However, on big numbers, these errors are mitigated and normalized over the entire dataset, thus allowing the extraction of business social dynamics.
This is an example of how pervasive, low-power, resource-constrained, and low-cost technologies can be used for the optimization of strategic processes. The point isn’t the technology it is how we use it.
We should start thinking of the problems we have to solve and not of the technology we have to improve.
Share This Story, Choose Your Platform!
About the Author: Daniele Mazzei
Follow Zerynth on
Latest Posts


 Related Posts